The Xdebug is the extension for PHP that helps debugging PHP scripts by providing a lot of valuable debug information. The debug information includes stack traces and function traces in error messages, memory allocation and protection for infinite recursions.
Installing Xdebug
The Xdebug is freely available from http://xdebug.org/.
If you use Windows, you can download the precompiled module for your PHP version. Installation is easy. Just place the DLL file to a directory (e.g. c:\php\ext) and add the following line to the php.ini file:
zend_extension_ts="c:\php\ext\php_xdebug-4.4.1-2.0.5.dll"Don’t forget to change the path and filename to the correct one. Note that from PHP 5.3 onwards, you need to use zend_extension instead of zend_extension_ts.
Restart your web server. Create a php file that calls phpinfo() or use php -m if you have a command line version of PHP. Information about Xdebug module should appear twice (once under PHP Modules and once under Zend Modules).

Note that Xdebug does not work together with Zend Optimizer or any other Zend extension (DBG, APD etc). Perhaps you’ll have to comment the line of Zend Optimizer.
;zend_extension_manager.optimizer_ts = "C:\php\zendOptimizer\lib\Optimizer"Now Xdebug is installed and configured. You may start using it right away or go on reading the article and learn how to debug PHP scripts in the Notepad++.
Using Xdebug and Notepad++ with DBGp plugin
To debug your scripts in the Notepad++, you need to perform next steps.
Install Xdebug as described above.
Add the following lines to the php.ini file just below the line zend_extension_ts=”c:\php\ext\php_xdebug-4.4.1-2.0.5.dll”:
xdebug.remote_enable=1
xdebug.remote_handler=dbgp
xdebug.remote_host=127.0.0.1
xdebug.remote_port=9000
xdebug.remote_mode=req
xdebug.idekey=default
xdebug.remote_log="c:\tmp\xdebug\xdebug.log"
xdebug.show_exception_trace=0
xdebug.show_local_vars=9
xdebug.show_mem_delta=0
xdebug.trace_format=0
xdebug.profiler_enable  = 1
xdebug.profiler_output_dir ="c:\tmp\xdebug"
Make sure you create the folder c:\tmp\xdebug\ or replace it with your folder. Then restart your web server. With these steps Xdebug is configured for profiling application and remote debugging.
Download and install the Notepad++ (V4.3 or higher).
Download the latest release of DBGp plugin. Unzip the file and move dbgpPlugin.dll to the plugins folder of your Notepad++ installation folder (e.g. C:\Program Files\Notepad++\plugins). Be sure to read the Readme.txt that is bundled with plugin for the latest information.
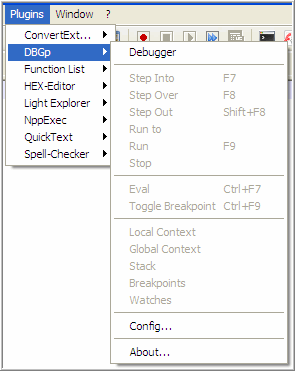
Now open the Notepad++. You should see the DBGp option in the plugins menu.

If you receive the error message that DBGp plugin is not compatible with current version of the Notepad++, install the earlier Notepad++ version (V4.4 works fine).
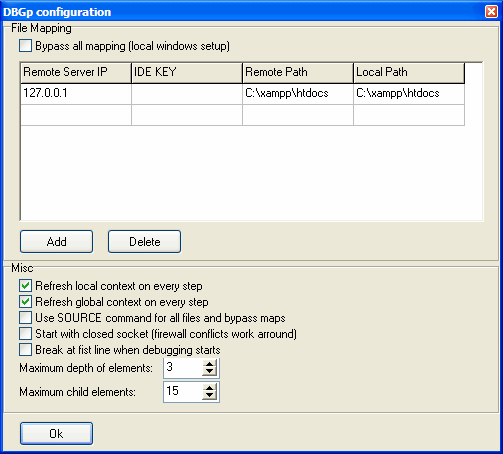
Click the Config… item and configure the DBGp debugger as shown. The Remote Path and Local Path is the folder where your php files reside.

Click Ok and you are done!
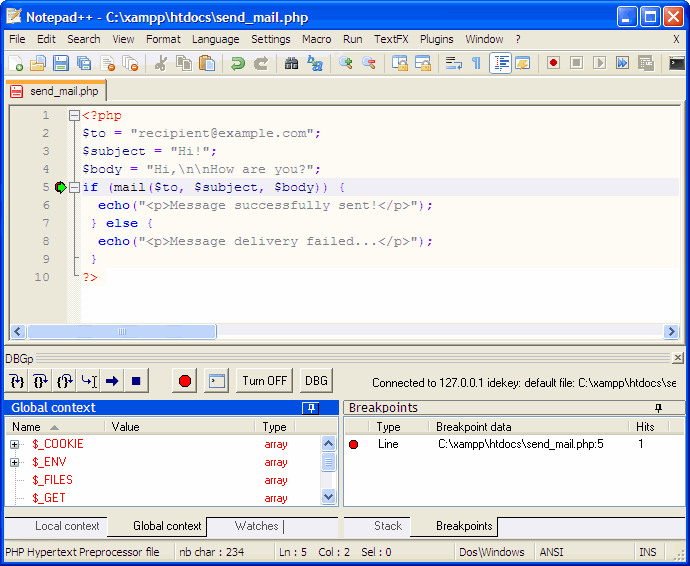
To start debugging open a php file in the Notepad++ and add a breakpoint to the script. In a browser add ?XDEBUG_SESSION_START=session_name to the end of the url. session_name could be anything you want (e.g. http://localhost/test.php?XDEBUG_SESSION_START=test). You should see the Notepad++ icon blinking on the taskbar. Click on it and start debugging.

There is the Mozilla Firefox extension Xdebug Helper that allows you to start/stop debugging and profiling without having to use XDEBUG_SESSION_START as parameter.
Related information
See also how to use the Xdebug with the other PHP editors and IDEs: